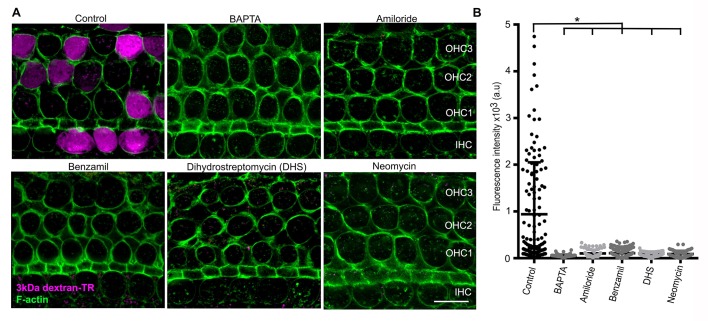
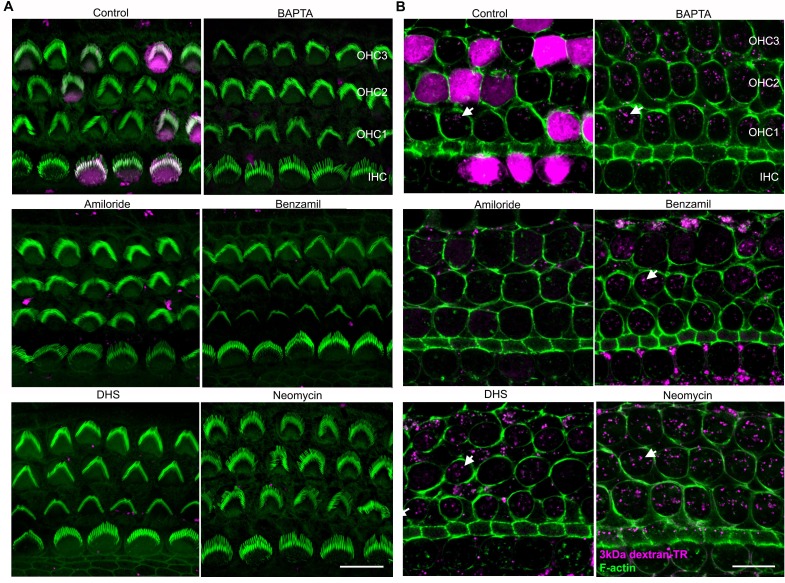
Figure 8. Breaking tip-links and blockade of the MET channel abolish dextran uptake.
(A) Representative confocal images of hair cells after incubation with 3 kDa dextran-TR in the absence (control) or presence of BAPTA (5 mM) or MET channel blockers; amiloride (150 µM), benzamil (30 µM), neomycin (500 µM), dihydrostreptomycin (500 µM). 3 kDa dextran-TR fluorescence is shown in magenta and tissue was counterstained with phalloidin for visualization of the hair cell boundaries (green). The three rows of outer hair cells (OHC) and one row of inner hair cells (IHC) are indicated and the scale bar represents 20 μm. (B) Quantification of 3 kDa dextran-TR fluorescence intensity in the cell body of hair cells in the absence (control, n = 133) or presence of BAPTA (n = 116), amiloride (n = 72), benzamil (n = 111), DHS (n = 64) or neomycin (n = 80). Each dot represents a single hair cell, and mean and standard deviation for each condition are shown. Asterisks indicate significant differences between the control and different blocker conditions (p< 0.01, one-way ANOVA with Turkey´s multiple comparison test).


