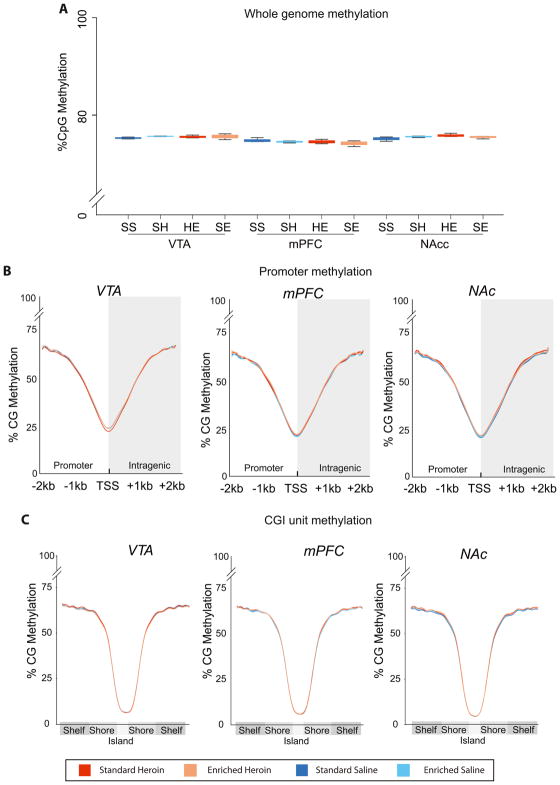
Figure 2. CG methylation levels across whole genome, and promoter and CG island regions.
Low coverage whole genome bisulfite sequencing was performed across VTA, NAc, and mPFC brain regions. (A) Total methylation counts / total counts for CG was used to determine the average genomic methylation per sample (n=3/group). (B) Profiles of the average CG methylation across all annotated promoters were generate for +/− 2kb of the transcription start site (TSS). (D) Similarly, average CG methylation profiles for all annotated CG islands, shores and shelves were calculated per animal. No differences across the whole genome, promoters or CG island unites were observed.

