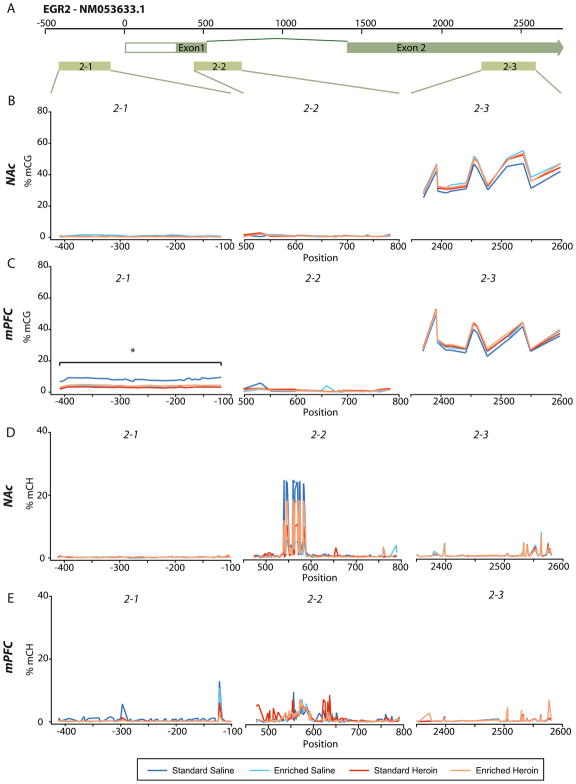
Figure 5. Site-specific CpG and CH methylation of EGR2 in the mPFC and NAc.
Bisulfite amplicon sequencing (BSAS) was used to assess site-specific methylation in EGR2. (A) Representation of EGR2 gene (promoter and gene body) and BSAS primer placement (2–1, 2–2, 2–3). (B) No site-specific differences in methylation were observed in EGR2 within the NAc. (C) Site-specific methylation differences were observed in the promoter region and gene body of EGR2 in the mPFC. (D) Higher CH methylation at site 569 was observed in the NAc of the standard saline group. (E) No differences in CH methylation were observed in the mPFC. 2-way ANOVA, n=5–10/group.

