
Figure 2. Geographical Distribution of Persons in the Truven Health MarketScan Commercial Databases in the United States in 2014.
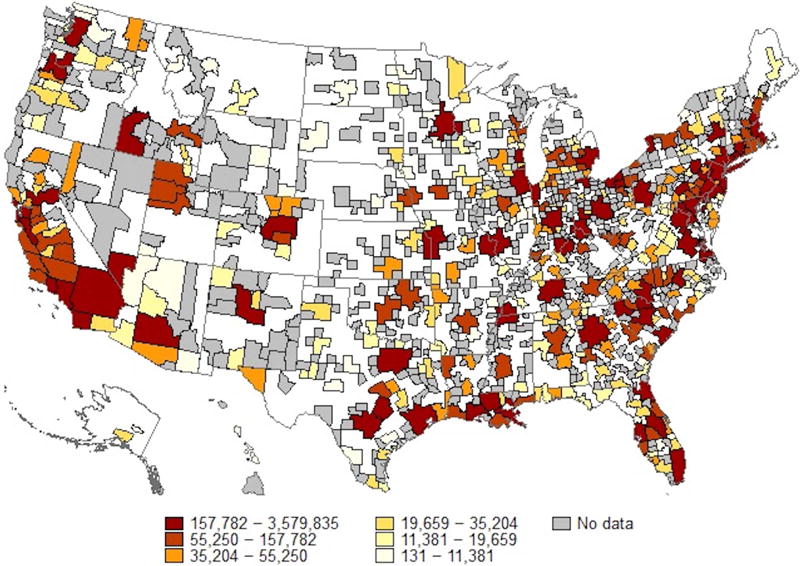
Each color represents the number of persons in the database that are located within each of the defined metropolitan statistical areas (MSA) in 2014. White regions represent rural areas where patients may have been present, but no MSA information exists, whereas grey regions represent places without patient representation in the database in 2014.