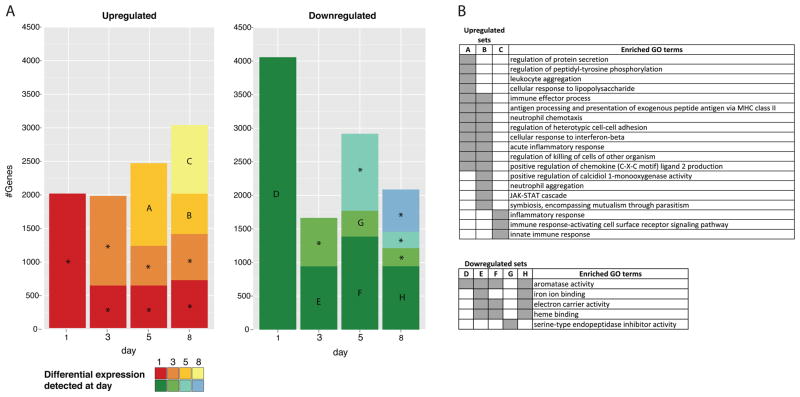
Figure 1. Genes differentially expressed during the course of infection in comparison to non-infected mouse (day 0).
(A) Colored bars indicate the number of transcripts detected on each day (X-axis) and the day they were first detected according to colors in the legend. Only transcripts with significant difference in expression (FDR lower than 0.01 and 16-fold change) when compared to day 0 were accounted. Bars marked with letters represent sets of transcripts with significant enrichment (Bonferroni adjusted p-value < 0.05) of at least one GO term. Gene Ontology enrichment analysis is described in the Material and Methods section. Bars marked with an asterisk indicate sets with no significant enrichment. (B) Summarized list of GO terms enriched in the sets defined on panel A. GO summarization is described in the material and methods section. Gray blocks indicate the set (table header) in which the GO term has a proportionally higher frequency than expected by chance.

