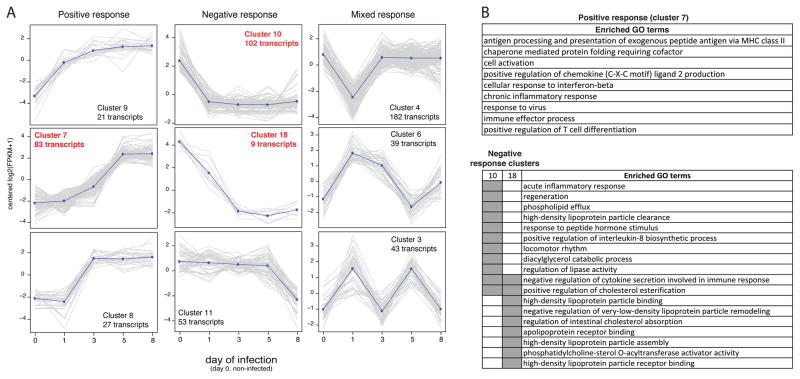
Figure 2. Cluster of transcripts presenting a similar profile of expression during the course of the infection.
(A) Graphs depicting the normalized FPKM (Y-axis) of members of each cluster during the 8 days of sample collection (X-axis). Dark blue lines describe the approximate general pattern presented by members of each cluster. Graphs with caption in red indicate clusters with enriched GO terms. (B) Summarized list of GO terms enriched on cluster 7, 10 and 18. Gray blocks indicate the set (table header) in which the GO term has a proportionally higher frequency than expected. GO enrichment analysis and GO terms summarization are described in the Material and Methods section.

