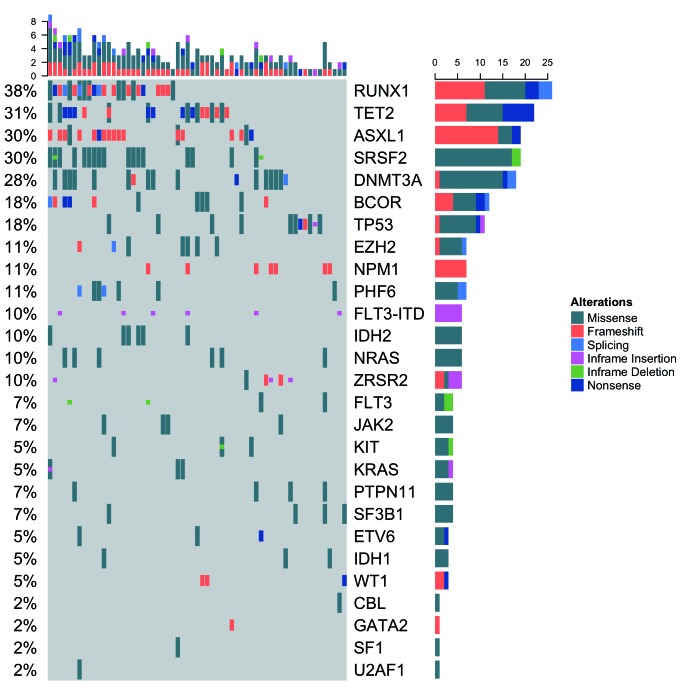
Figure 2.
Mutational profile of patients studied. Each column indicates a patient, while each row indicates a gene tested (right label) and the percent of patients mutated for each gene (left label). Each mutation is colored according to the mutation type(s) present. Bar plots show the number of mutations per patient (top) and the total number of mutations per gene (right).

