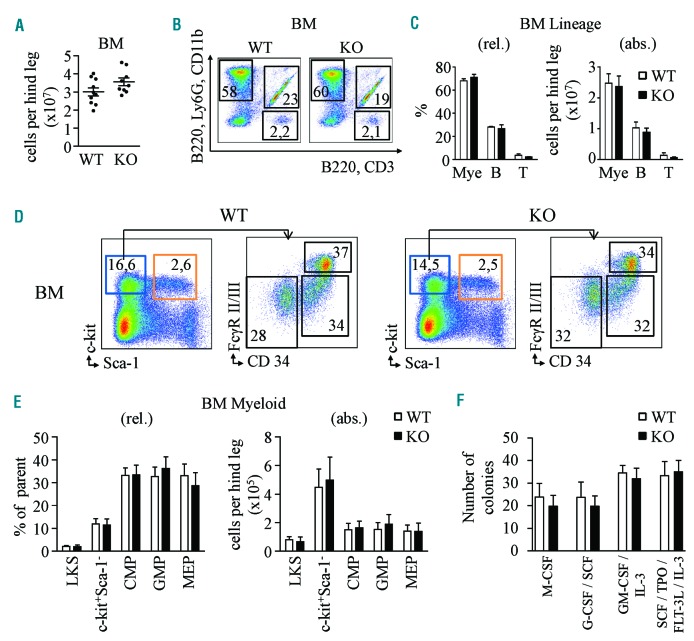
Figure 1.
Steady-state granulopoiesis is not affected by genetic deletion of Cebpg gene. (A) BM cellularity in WT and Cebpg KO mice. Y axis indicates absolute number of cells per hind leg. (B) Representative flow cytometry plots from WT and Cebpg KO BM cells stained for myeloid (Ly6G, CD11b), B-cell (B220), and T-cell (CD3) markers. Upper left quadrant indicates percentage of myeloid cells, upper right the percentage of B cells, and lower right the percentage of T cells. (C) Quantification of myeloid cells (Mye), B cells (B), and T cells (T) based on flow cytometry data illustrated in panel B. Y axes indicate relative percentage (rel., left panel) and absolute number (abs., right panel) of cells. (D) Representative flow cytometry plots from WT and Cebpg KO BM cells. Left plots were gated from lineage negative cells and stained for c-kit and Sca-1 markers. Blue box indicates percentage of myeloid progenitor cells (lineage−, c-kit+, Sca-1+), and orange box indicates percentage of LKS (lineage−, c-kit+, Sca-1+) cells. Right plots represent expression of FcγRII/III and CD34 in myeloid progenitor cells. Lower left gate indicates percentage of megakaryocyte erythroid progenitor cells (MEP), lower right indicates percentage of common myeloid progenitor cells (CMP), and upper right percentage of granulocyte macrophage progenitor cells (GMP). (E) Quantification of panel D. (C–E) Each group contains 12 mice from three independent experiments. (F) Colony forming assays using WT (white bars) and Cebpg KO (black bars) BM cells. 7.5×10³ cells were plated per well. Y axis indicates total number of colonies per well. X axis indicate the cytokines included in each condition. Two-tailed Student’s t-tests were used to assess statistical significance. BM: bone marrow; WT: wild-type; KO: knockout; LKS: lineage−, c-kit+, Sca-1+ cells; SCF: stem cell factor; IL: interleukin; TPO: thrombopoietin; FLT-3L: FMS-like tyrosin kinase 3 ligand.

