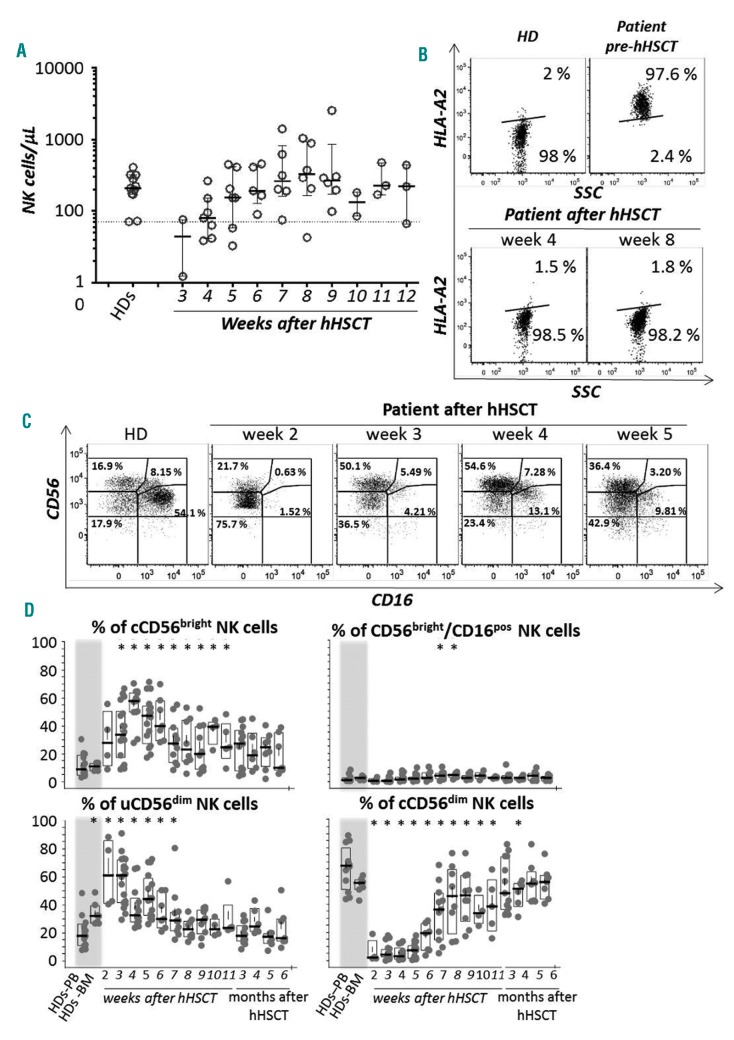
Figure 1.
Kinetic of NK cell subset immune reconstitution after haploidentical HSCT. (A) Summary graph showing the absolute counts (cells/μL) of circulating natural killer (NK) cells (mean ± SEM) from hematopoietic stem cell healthy donors (HDs) and their related recipients at different time-points after haploidentical HSCT (hHSCT). (B) Representative example of flow cytometry dot plots showing the complete chimerism of HD-derived HLA-A2neg NK cells reconstituting an HLA-A2pos recipient (upper line) after four and eight weeks from hHSCT (lower line). (C) Representative example of flow cytometry dot plots showing the kinetic of HD-derived NK cell subset distribution in the recipient after two, three, four and five weeks from hHSCT. (D) Summary statistical graph showing the frequency (median ± SEM) of conventional CD56bright/CD16neg-low (cCD56bright), CD56bright/CD16pos, conventional CD56dim/CD16pos (cCD56dim) and unconventional CD56dim/CD16neg (uCD56dim) NK cell subsets in the peripheral blood (PB) and bone marrow (BM) of 30 hematopoietic stem cell HDs compared to their counterparts in the blood of the related recipients up to six months after hHSCT. *P<0.05.

