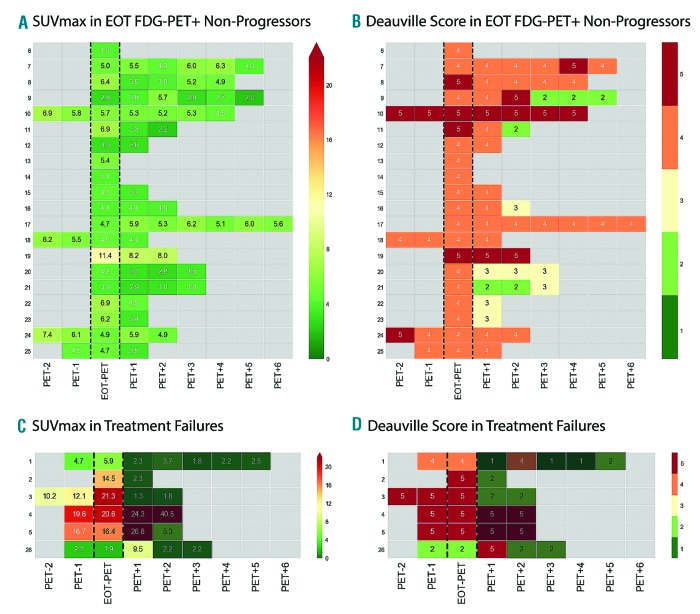
Figure 4.
Evolution of serial FDG-PET imaging. Heatmap depiction of (A). SUVmax, and (B). Deauville score, over time in the 20 non-progressing patients with a positive EOT FDG-PET scan. Heatmap depiction of (C). SUVmax, and (D). Deauville score, over time in the 6 patients with treatment failure. FDG-PET scans performed prior to the EOT FDG-PET are listed as negative numbers with those following the EOT FDG-PET listed as positive numbers. The EOT FDG-PET scan is bordered by black dashed lines. FDG-PET scans performed following salvage intervention are shaded in black.

