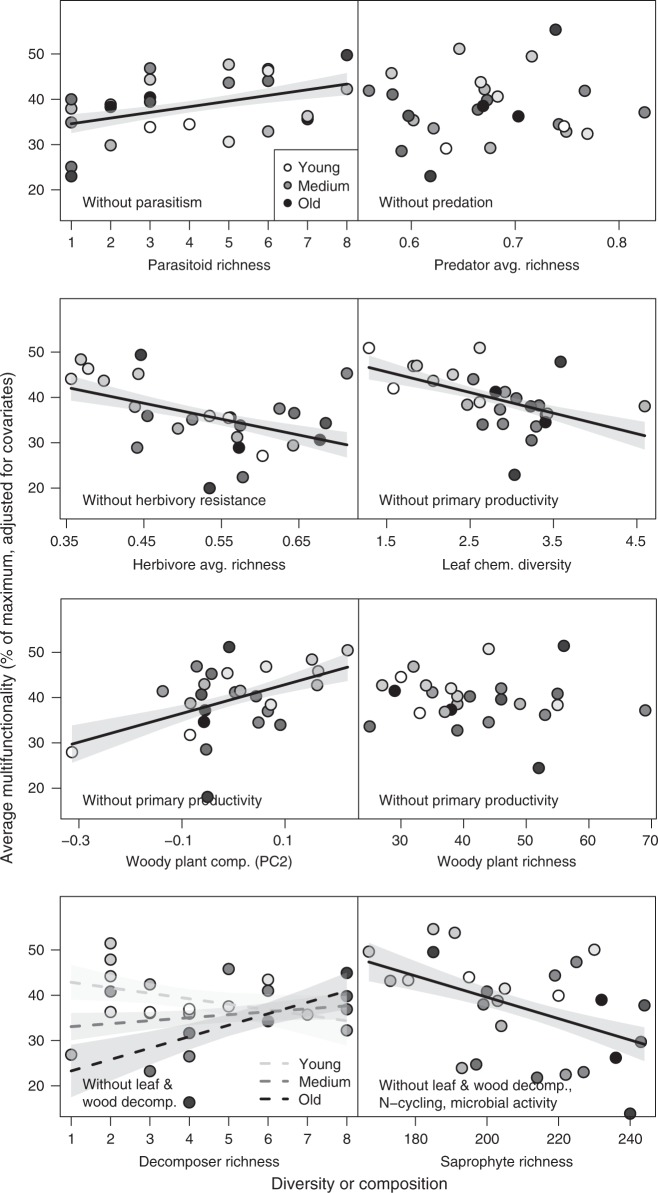
Fig. 3.
Biodiversity effects within individual trophic levels on average multifunctionality. Effects of individual models on woody plant diversity and composition, or heterotrophic species richness of individual trophic levels on multifunctionality as the average of five to eight standardized ecosystem functions (excluding functions directly mediated by a given trophic level). Values on the x-axis represent either increasing diversity or differences among study plots in species composition. Note that y-axis values show data adjusted for covariates (see Supplementary Fig. 12 for raw data). Solid regression lines ( ± 1 SE, fitted across all 26 plots, except for decomposer diversity, where lines are model predictions for young (40 years), medium (70 years), and old (100 years) forest stands) are adjusted for covariates and indicate significant (P ≤ 0.05) relationships. Broken lines indicate marginally significant (P < 0.07) relationships. The stand age of the study plots is indicated by a continuous gradient from white (youngest plots ~20-year-old) to black (oldest plots > 80-year-old); avg. average

