
Figure 11. Activation of P2Y1 receptors on preBötC inspiratory neurons in vitro evokes a thapsigargin‐sensitive, increase in [Ca2+]i .
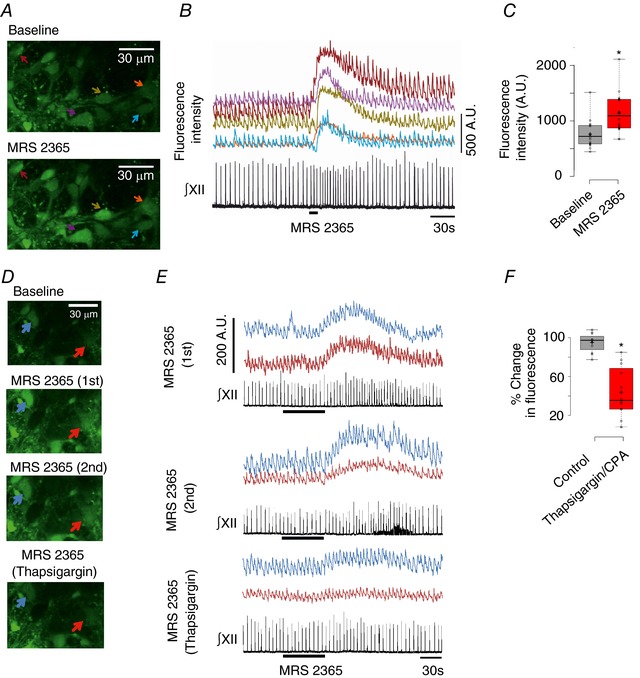
A, multiphoton images of baseline Fluo‐4 fluorescence indicating [Ca2+]i in five inspiratory neurons at a single optical plain (top), inspiratory‐related oscillations in [Ca2+]i and the peak [Ca2+]i increase evoked in response to locally applied MRS 2365 (100 μm, 10 s) (bottom) (B) [Ca2+]i increases in the neurons of (A) are synchronous with ∫XII and their responses to locally applied MRS 2365 (100 μm, 10 s). C, group data showing an increase of ∼50% in peak Fluo‐4 fluorescence in response to local application of MRS 2365 (100 μm, 10 s) over inspiratory preBötC neurons (n = 18, five slices; *significant difference between means, P < 0.0001, paired t test); AU, arbitrary units. D, multiphoton images of Fluo‐4 Ca2+ fluorescence in two inspiratory neurons at a single optical plain at baseline (top), at the peak of two control MRS 2365‐evoked (10 μm, 1 min, bath application) Ca2+ flourescence responses (top middle, bottom middle), seperated by 30 min intervals. The bottom image shows the response evoked by MRS 2365 after bath application of thapsigargin (100 μm, 30 min). E, traces of Fluo‐4 Ca2+ flourescence responses evoked by MRS 2365 in the same neurons shown in (D). F, box plot of group data comparing the decrease in peak MRS 2365‐evoked Fluo‐4 Ca2+ response that occurred between control responses 1 and 2 with the decrease in the MRS 2365‐evoked Ca2+ response that occurred between the second control MRS 2365 response and the MRS 2365 response in thapsigargin (or CPA) (n = 12, five slices; *significant difference between means, P < 0.0001, paired t test).