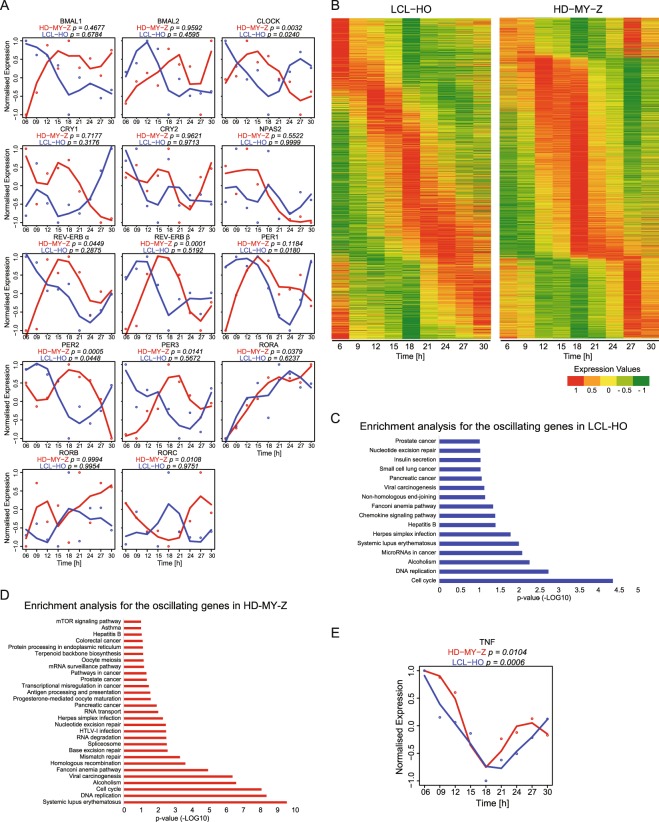
Figure 3.
The genome-wide landscape of oscillating genes in LCL-HO and HD-MY-Z revealed cell-specific circadian regulation in HL. (A) Depicted are expression values for core-clock genes for LCL-HO (blue) and HD-MY-Z (red) retrieved from the time course array data. (B) Oscillating genes present in LCL-HO and the HL cell line HD-MY-Z, respectively, phase ordered and normalized to values between −1 and 1. (C,D) Enrichment analysis (KEGG pathways) for the previously described genes in the different cell lines. (E) TNF relative gene expression retrieved from the array data in LCL-HO (p = 0.0006) and HD-MY-Z (p = 0.0104), respectively. (A,E) Based on the data from the time course HTA2.0 microarray experiments we performed an additional normalization in the range 1, −1. The normalized data was used to fit a curve with Local Polynomial Regression Fitting. The genes were analysed with the MetaCycle R package for a period set to 21 to 27 hours. The combined Metacycle p-values are displayed for each gene.

