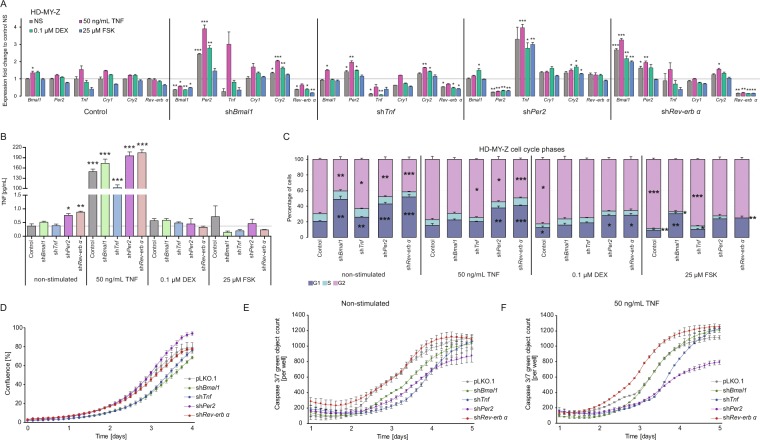
Figure 5.
Dysregulation of the core-clock and of Tnf led to differential cell cycle phenotypes in the HL cell line HD-MY-Z. (A) Gene expression qPCR data (n = 3, mean ± SEM). (B) TNF concentration in the supernatant (n = 3, mean ± SEM). (C) Cell cycle measurements after KD of Bmal1, Tnf, Per2 and Rev-erbα followed by stimulation for 3 days with 50 ng/mL of recombinant human TNF, 0.1 µM dexamethasone and 25 µM of forskolin (n = 3, mean ± SEM). (D) Proliferation analyses of HD-MY-Z cell line after shRNA KDs. (E,F) Apoptosis analysis of HD-MY-Z cell line after KDs in both non-stimulated and TNF (50 ng/ml) stimulated conditions, respectively (n = 3, mean ± SEM). Statistics for the comparison to non-stimulated (NS) control *p < 0.05, **p < 0.01, ***p < 0.001.

