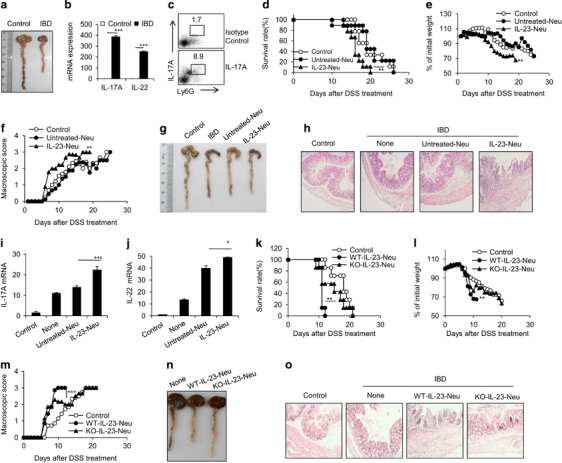
Figure 4.

IL-23-treated neutrophils promote dextran sulfate sodium (DSS)-induced colitis. Colitis was induced by adding DSS (2.5%) to drinking water as described in the Materials and Methods. (a) Morphological analysis of colons from wild-type and DSS-induced colitis mice. (b) mRNA expression levels of IL-17A and IL-22 in the sorted CD11b+Ly6G+ neutrophils from control and DSS-treated colonic tissues were detected by real-time PCR. (c) IL-17+ neutrophils in colons of control and DSS-induced colitis mice were detected by flow cytometry. Survival rate (d), body weight (e), macroscopic score (f) and representative pictures (g) of colons from control and DSS-induced colitis mice adoptively transferred with PBS, 5 × 10⁶ untreated-Neu or IL-23-treated-Neu cells (sorted CD11b+Ly6G+ neutrophils) per mouse on day 0, 2 and 5 are summarized. (h) H&E staining of colonic tissues from control or DSS-induced colitis mice treated as described above. mRNA expression levels of IL-17A (i) and IL-22 (j) in colonic tissues from mice treated as described above were detected by real-time PCR. Survival rate (k), body weight (l), macroscopic score (m) and representative pictures (n) of colons of control and DSS-induced colitis mice adoptively transferred with PBS, 5 × 10⁶ untreated neutrophils, IL-23-treated neutrophils or IL-17A-deficient IL-23-treated neutrophils (sorted CD11b+Ly6G+ neutrophils) per mouse on days 0, 2 and 5. (o) H&E staining of colonic tissues from control or DSS-induced colitis mice treated as described above are presented. Data are expressed as the mean±s.d. (n=3–5) and one representative example from three independent experiments with similar results is shown. *P<0.05, **P<0.01 and ***P<0.001 for comparisons between the indicated groups. Data were analyzed by the Mann–Whitney U-test or two-way ANOVA using SPSS software. Survival curves were analyzed by the log-rank test.
