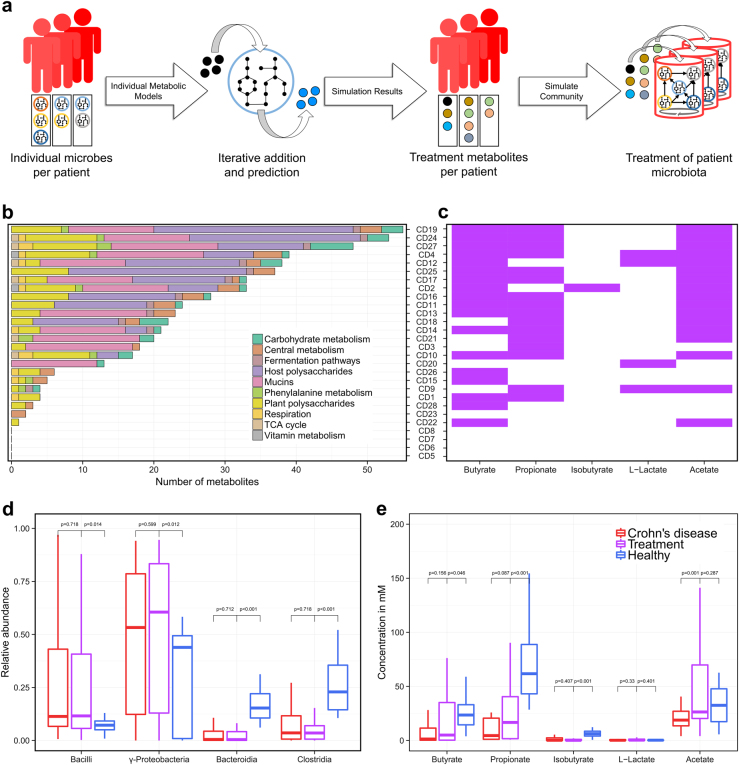
Fig. 5.
Individual treatment prediction for each CD patient. For the prediction of treatment metabolites a, single metabolic models of microbes for each patient were optimized for the production of the target metabolites with iterative dietary additions. b Shows broader categories of the predicted metabolites and c shows the response (metabolite increase of 25%) of each patient in purple. d, e show the relative abundance and metabolite concentrations

