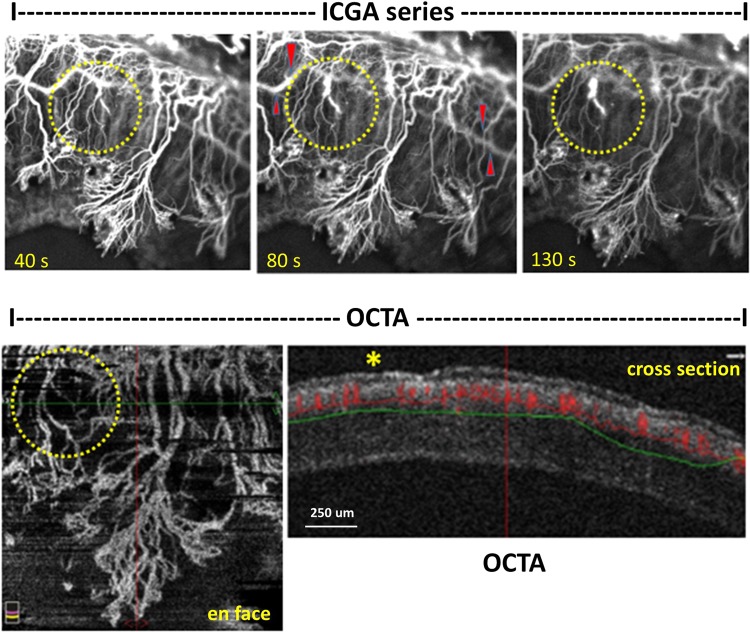
Figure 4.
Stained vessels in indocyanine green angiography (ICGA) image series correspond with ‘no signal’ vessels in optical coherence tomography angiography (OCTA). A series of ICGA images (top row, 40, 80 and 130 seconds, respectively) show leakage from corneal vessels (in yellow circles), increasing in intensity over time, while the overall vessels signal intensity reduces. Note the strong background signal of horizontal iris vessels (indicated by red Δ) interferes the ICGA corneal vessels. ‘En face’ OCTA scan (bottom left) detects the same vessels in ICGA. Corresponding cross-sectional B scan (bottom right) shows ‘no flow’ of blood (marked by *) in the leakage vessels. The cross-sectional plane is indicated by a green horizontal cross line in the en-face scan. Note, cross-sectional scan shows that all induced vessels, represented by a red signal of the blood flow, are located above the green horizontal line, which indicates the approximate 200 microns depth of scan, thus in the anterior corneal stroma.

