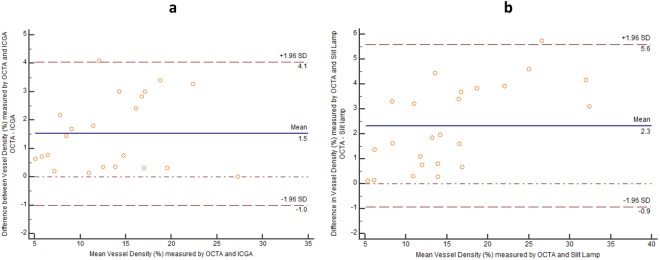
Figure 5.
Vessels density measurements from optical coherence tomography angiography (OCTA) compared with indocyanine green angiography (ICGA) and slit lamp photography (SLP). The Bland-Altman plot between the differences of vessels density measurements from OCTA and ICGA (y-axis) in (a) (OCTA and SLP in b) against the average vessels density measurements of the 2 methods (x-axis) —showing good agreement of vessels density obtained from both imaging methods. The measurements of the density of corneal vessels within the region of interest were obtained from 22 sets of matched OCTA and ICGA images and 23 sets of matched OCTA and SLP images. The mean difference between OCTA and ICGA = 1.5 ± 2.6% (95% CI, 0.9526 to 2.0957%, P < 0.0001). Limits of agreement (±1.96 SD) = 4.1 and −1.0%. The mean difference between OCTA and SLP = 2.3 ± 3.3% (95% CI, 1.5135 to 2.8416%, P < 0.0001). Limits of agreement (±1.96 SD) = 5.6 and −0.9%. Solid line = mean of the difference. Short dashed line = reference zero. Long dashed line = upper and lower 95% limits of agreement (mean + 1.96 SD, mean −1.96 SD). SD = standard deviation of the mean difference.

