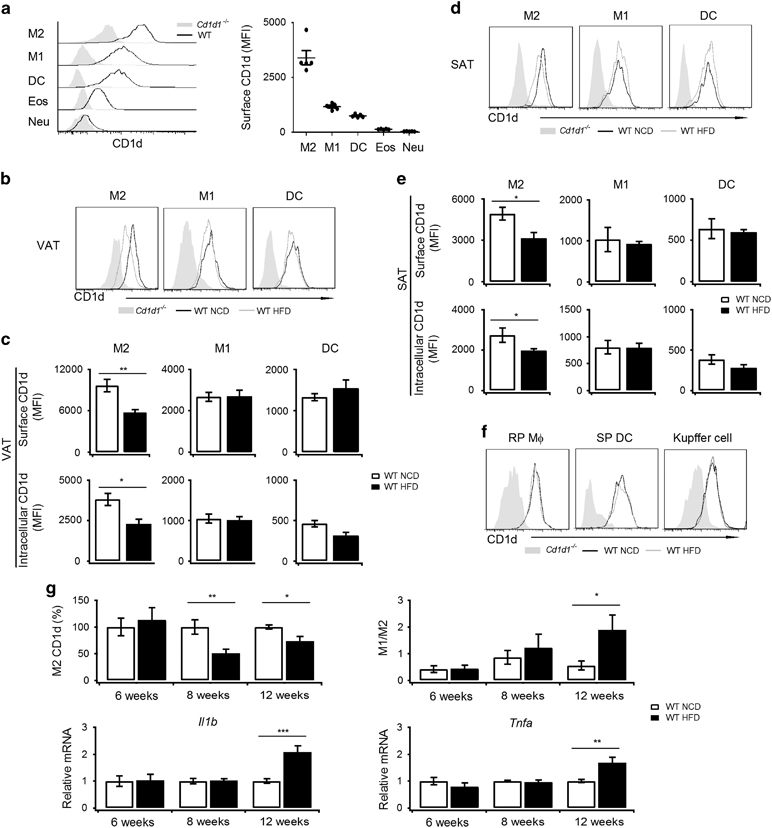
Figure 1.

M2-specific reduction of CD1d occurs prior to the onset of metaflammation. (a) CD1d surface expression in the indicated cells in VATs was measured via FACS (black line). Cd1d1 −/− mice were used as negative controls (gray solid). Mean fluorescence intensity is presented on the right (n=5 mice per group); Cd1d1 −/− mice were used to measure the non-specific staining of CD1d, which was subtracted as background. (b–f) CD1d expression in mice on NCD or HFD for 16 weeks. CD1d surface expression on the indicated cells in VATs (b), SATs (d), spleens and livers (f) was measured via FACS (NCD, black line; HFD, gray line). Cd1d1 −/− mice were used as negative controls (gray solid). Mean fluorescence intensity of surface and intracellular CD1d in the indicated cells in VATs (c) or SATs (e) (NCD, white bar; HFD, black bar); Cd1d1 −/− mice were used to measure the non-specific staining of CD1d, which was subtracted as background. The data are pooled from two independent experiments with 5 to 6 mice per group. (g) Surface CD1d on M2 macrophages, M1/M2 ratio, and mRNA level of Il1β and Tnfα in VATs of mice on NCD or HFD for 6 weeks, 8 weeks and 12 weeks (n=5–8 mice per group; NCD, white bar; HFD, black bar). Data are represented as the mean±the s.e.m. *P<0.05, **P<0.01, ***P<0.001. HFD, high fat diet; NCD, normal chow diet; SATs, subcutaneous adipose tissues; VATs, visceral adipose tissues.
