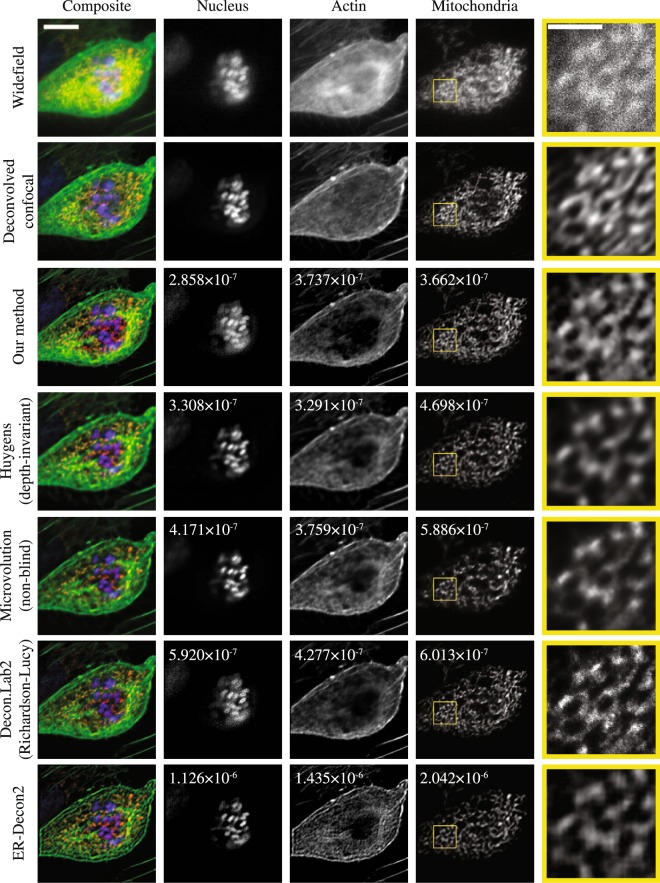
Figure 2.
A comparison of 3D deconvolution software used to process a low SNR, 512 × 512 × 22 voxel widefield fluorescence focal stack. The focal stack was captured with three color channels (the first row) and then deconvolved with six deconvolution software methods (rows three through eight). The second row shows a confocal microscope image deconvolved with the Huygens software as a baseline for comparison. The fifth column shows the magnified image of the yellow rectangle in the corresponding mitochondria image. The composite images (the first column) show the sixth z slice of a pseudo-colored 3D image combining the three color channels. The nucleus, actin and mitochondria images (the second, third and fourth columns) show the eleventh, fourth and sixth z slice of the deconvolved 3D images. The scale bar in the composite image is 10 μm, and the scale bar in the magnified image is 3 μm. The number written in the figures are the minimum NMSE measured when comparing these data to deconvolved confocal images. All XY slices of the focal stacks are shown in a sequence in Supplementary Video 2.

