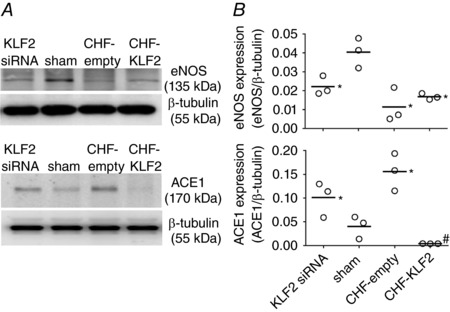
Figure 6. CB ACE1 and eNOS expression in CHF rabbits.

Representative western blot (A) and mean data (B) showing that CB eNOS expression is reduced in CHF and with KLF2 siRNA knockdown, and that CB ACE1 expression is increased in CHF and reduced by viral transfection with KLF2. * P < 0.05 vs. sham. # P < 0.05 vs. CHF‐empty. n = 3 rabbits per group. Results are expressed as a scatter plot with mean indicated by the horizontal black bar.
