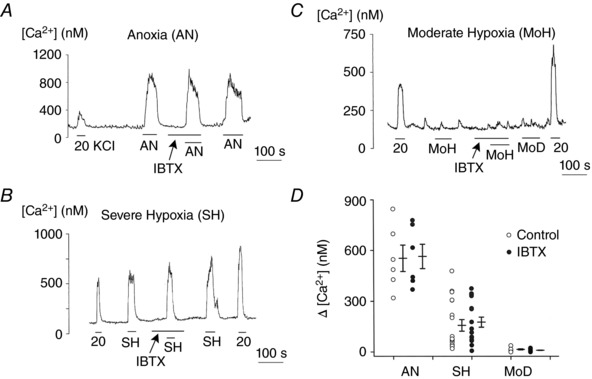
Figure 5. Lack of effect of IBTX on anoxia‐ and hypoxia‐induced elevation of [Ca2+]i .

A, glomus cells were perfused with normoxic bath perfusion solution containing 5 mm KCl, and change in [Ca2+]i was recorded in response to anoxia with and without 100 nm IBTX. Five coverslips of cells were used (total of 106 cells). B and C, same experiments as in A, except that changes in [Ca2+]i were recorded in response to severe hypoxia (B; 18 coverslips: n = 158 cells) and moderate hypoxia (C; 9 coverslips: n = 106 cells). Changes in [Ca2+]i in response to hypoxia were recorded with and without IBTX. D, scatter plot showing change in [Ca2+]i (Δ[Ca2+]i) produced by anoxia and hypoxia. Vertical lines are mean ± SEM of 5–18 coverslips of cells, where each circle is the mean value from a coverslip containing multiple glomus cells. No significance was present between control and IBTX groups (P = 0.92 for AN, P = 0.85 for SH and P = 0.81 for MoH).
