
Figure 4. Comparison of ventilatory variables during hypercapnia in periods with or without recruitment of active expiration.
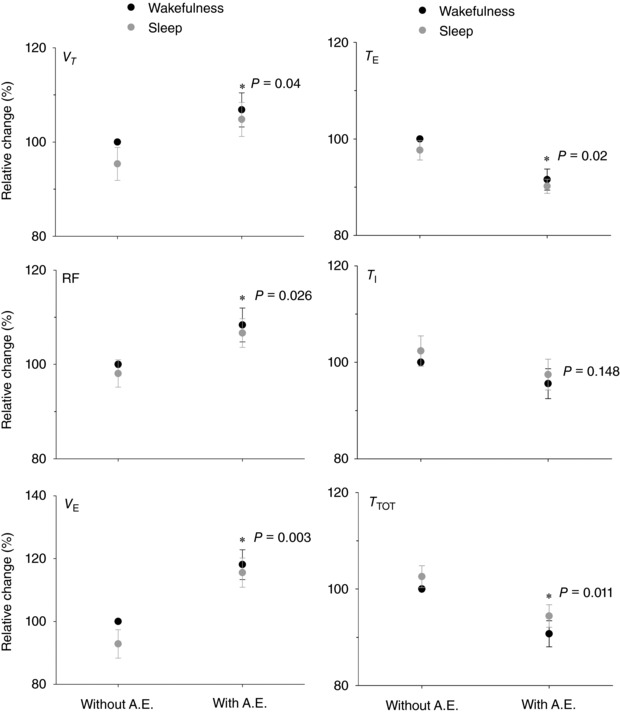
V T and T E top panels, RF and T I middle panels, and VE and T TOT bottom panels. (*) indicates difference (P < 0.05) comparing the ventilatory variables with and without active expiration (A.E.) (n = 7). The P values are indicated.