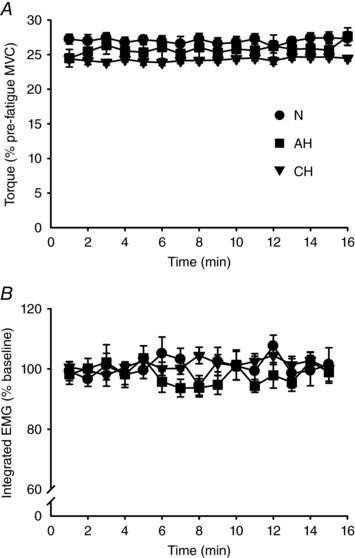
Figure 3. Elbow flexor torque and biceps brachii integrated EMG during the fatiguing protocol.

Mean ± SEM values in normoxia (N, ), acute hypoxia (AH, ■) and chronic hypoxia (CH,▼). A, elbow flexor torque obtained from the last 25% MVC contraction of each minute. B, integrated EMG from the last contraction of each minute expressed as a percentage of the value obtained during baseline contractions at 25% MVC. Torque and iEMG were targeted accurately throughout the protocol and did not differ across sessions (P = 0.60 and P = 0.84 for torque and iEMG, respectively).
