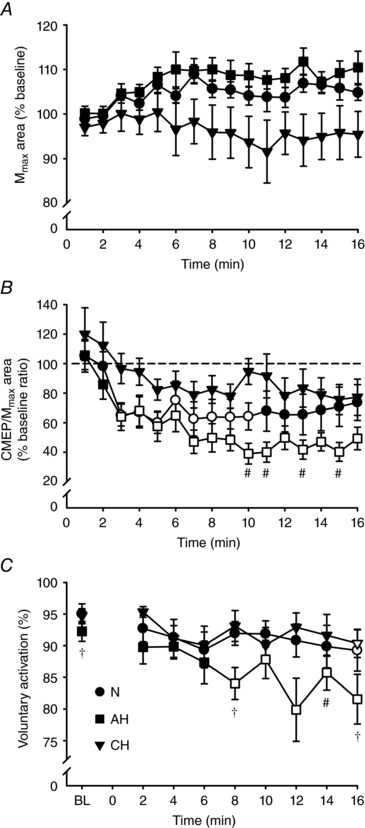
Figure 5. Maximal compound muscle action potential area, cervicomedullary motor evoked potential area and cortical voluntary activation across the fatiguing protocol.

Mean ± SEM values in normoxia (N, ), acute hypoxia (AH, ■) and chronic hypoxia (CH,▼). Open symbols represent data points significantly lower than baseline values. Area of M
max (A) and area of CMEP (B) normalized to the area of the M
max evoked during the same contraction each minute, expressed as a percentage of the baseline value. C, absolute values of cortical voluntary activation measured at baseline (BL) and every 2 min during the fatiguing protocol. At the 10th, 11th, 13th and 15th min, CMEP area was lower in AH compared to CH (#
P < 0.05). Cortical voluntary activation was lower at BL and the 8th and 16th min in AH compared to both N and CH (†
P < 0.05), and at the 14th min in AH relative to CH (#
P < 0.05).
