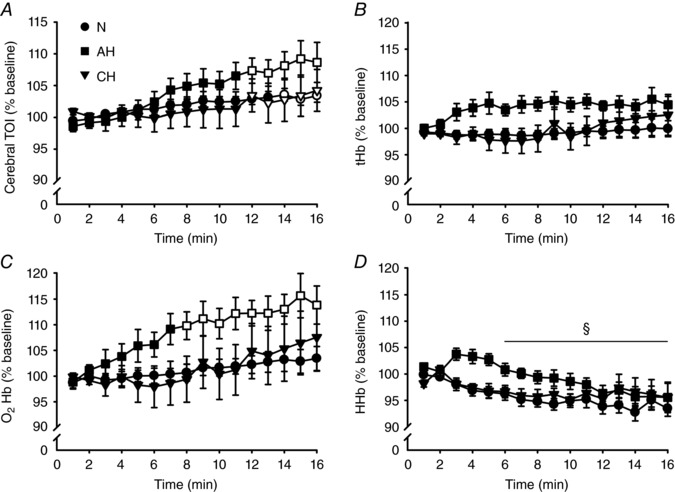
Figure 6. Near‐infrared spectroscopy parameters during the fatiguing protocol.

Mean ± SEM values over 1 min windows in normoxia (N, ), acute hypoxia (AH, ■) and chronic hypoxia (CH,▼). All values are expressed as a percentage of baseline. Open symbols represent data points significantly higher than baseline values. A, cerebral TOI. B, tHb. C, O2Hb. D, HHb. During the second half of the protocol, TOI was higher in all conditions, whereas O2Hb was higher only in AH. For HHb, data were pooled across sessions (no main effect of session, nor a session × time interaction) and post hoc testing on the main effect of time revealed a decrease from the 6th min onward (§
P < 0.05).
