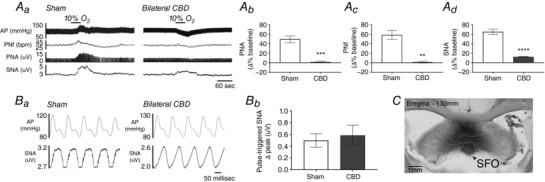
Figure 3. Confirmation of CBD and microinjection site in the SFO.

Aa, a 45 s hypoxia challenge on AP, PNf, PNA and SNA in a Sham‐operated (left) and CB denervated (right) rat. Grouped data quantifying the percentage change from baseline for (Ab) PNA, (Ac) PNf and (Ad) SNA in Sham‐operated vs. CB denervated rat (**** P < 0.0001; *** P < 0.001, ** P < 0.01 vs. Sham). Ba, baroreflex modulation of SNA in Sham and CBD rats. Bb, grouped data showing SNA fluctuation in Sham and CBD rats. C, an example of a successful injection in the SFO marked with Chicago blue dye in a coronal section of brain at Bregma level −1.33 mm. Scale bar = 1 mm.
