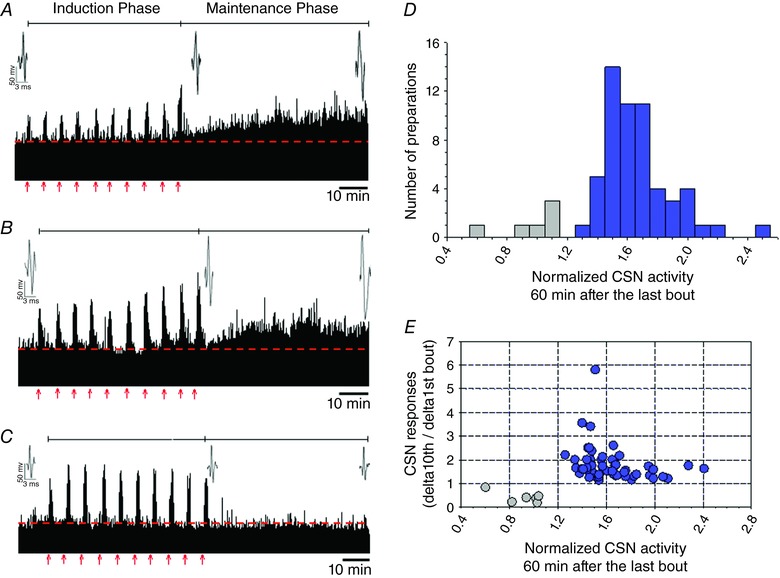
Figure 1. AIH‐Hc causes sensory LTF in ex vivo CB from naïve rat.

Examples of rectified CB sensory activity (A–B) from three preparations exposed to ten 1 min bouts of hypoxia‐hypercapnia (red arrows; each interspersed with 5 min of normoxia‐normocapnia). Insets represent action potentials from a single unit. During AIH‐Hc (i.e. the induction phase), most preparations had augmenting responses with each bout (A, recirculating effluent; B, non‐recirculating effluent). We observed a small number of preparations with decrementing responses, C, after AIH‐Hc (i.e. during the maintenance phase), CSN activity increased in (A) and (B) (indicative of sensory LTF) but not in (C) (no sensory LTF). D, magnitude of CSN activity 60 min after the last hypoxia‐hypercapnia bout (n = 63). In total, 57 preparations demonstrated sensory LTF (blue); in the remaining six, sensory LTF was absent (grey). E, scatter plot showing the relationship between the change in CSN activity between the first and last (10th) bout of hypoxia‐hypercapnia compared to the CSN activity at 60 min after the last bout. Only preparations in which responses increased with bouts demonstrated sensory LTF (blue). However, the degree of augmentation did not predict sensory LTF magnitude (P = 0.06; r 2 = 0.02). Note that CSN activity is normalized to the baseline preceding the first bout (dashed line). [Color figure can be viewed at http://wileyonlinelibrary.com]
