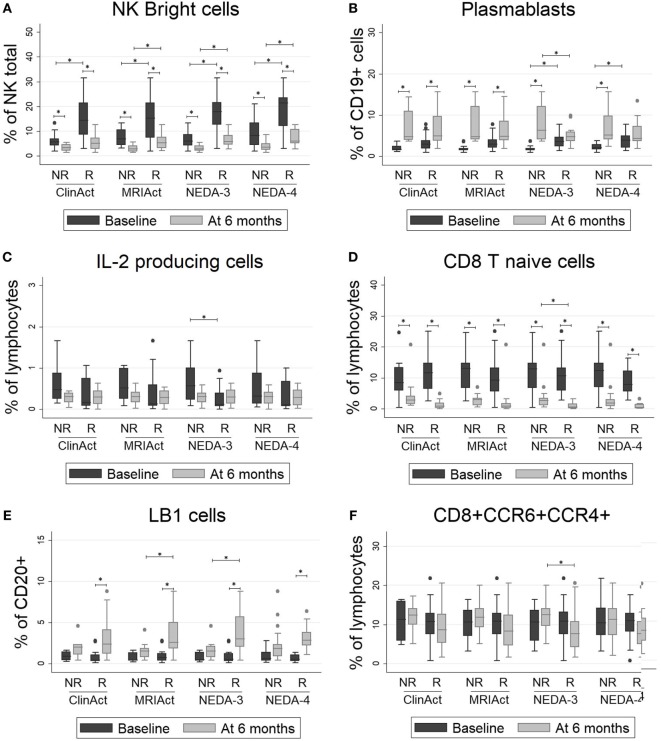
Figure 2.
(A–F) Lymphocyte subpopulations with significant differences between responder (R) and non-responder (NR) patients: NK bright cells, plasmablasts, IL2-producing cells, CD8 T naïve cells, LB1 cells and CD8+CCR6+CCR4+ cells. The percentages of lymphocyte subpopulations at baseline and at 6 months of treatment are shown for different subgroups according to clinical response by four different measure ways: ClinAct: clinical activity (NR = clinical activity present, R = clinical activity absent); MRIAct: radiological activity (NR = radiological activity present, R = radiological activity absent); NEDA-3 (NR = no evidence of disease activity by NEDA-3 criteria, R = evidence of disease activity by NEDA-3 criteria); and NEDA-4 (NR = no evidence of disease activity by NEDA-4 criteria, R = evidence of disease activity by NEDA-4 criteria). The p-values were calculated using the Wilcoxon signed-rank test to compare differences before and after 6 months of therapy and using Mann–Whitney test to compare differences between subgroups. p < 0.001 was considered statistically significant after Bonferroni’s correction for multiple tests.

