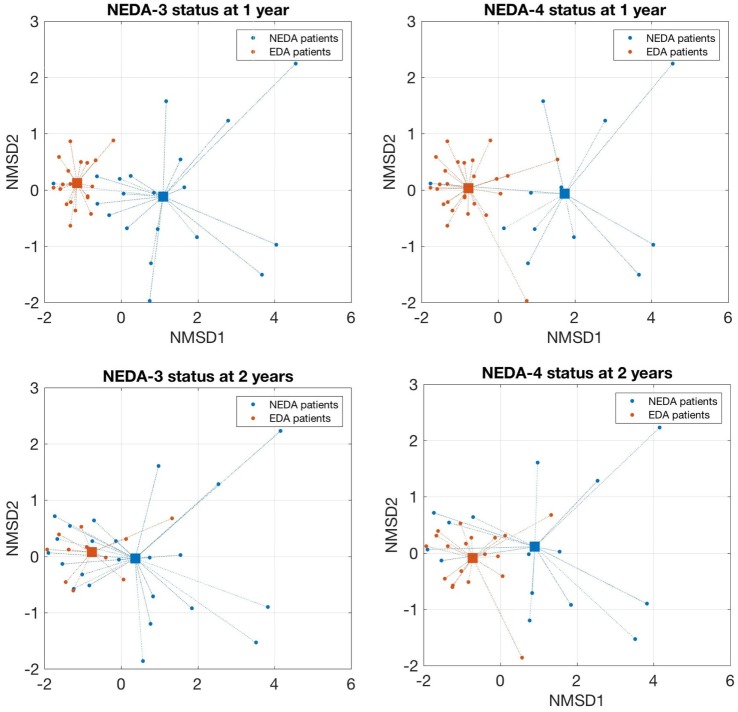
Figure 3.
Nonparametric multidimensional scaling of selected lymphocytes subpopulations that discriminates responders and non-responder patients. A 2D representation by nonparametric multidimensional scaling (Seuclidean method) of the percentages of four selected lymphocyte subpopulations measured before treatment [natural killer (NK) bright, NK dim, plasmablasts, and IL-2-producing cells]. Individual patients and distance from the average of each condition are shown. Patients with a good response to fingolimod at 1 year (NEDA-3 and NEDA-4) were located in a well-differentiated region of space when the subpopulations are measured before treatment. At 2 years, this differentiation was less evident.

