
FIGURE 4.
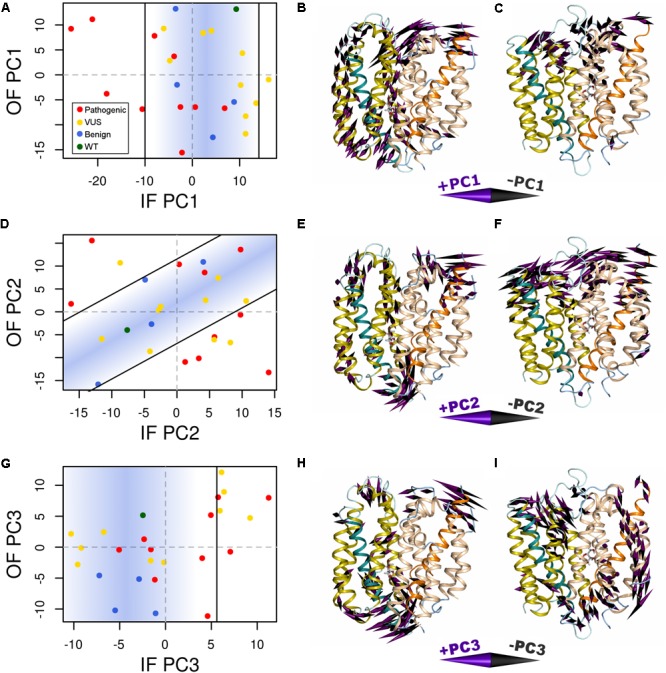
Variants alter conformational dynamics. The conformational dynamics within our MD trajectories of GLUT10 were evaluated using PCA. (A) The median PC1 coordinate of each variant from each initial conformation is shown. Specific variants shifted the inward-facing (IF) dynamics in the negative direction further than was observed in any of the simulations of benign variants or the WT, while there is no clear separation between types of variants from the outward-facing (OF) dynamics. Black lines indicate the bounds of the densest 75% of WT and benign simulations, and a blue gradient is used to highlight this same region; see the section “Materials and Methods.” Variants whose median values are outside of this area are considered altered in the PC motion. (B) We visualized the IF PC1 in 3D by placing a cone at each residue that is proportional to its magnitude and direction. Small motions are omitted for clarity. The positive direction of IF PC1 indicates motion of the intracellular sides of H1, H3, and H4 away from the C-terminal bundle with shifting of H5 upward toward the extracellular side and motion of the extracellular sides of H8 and H10 away from the N-terminal bundle. These motions coincide with some of the transitions toward the OF conformation. (C) We visualized the OF PC1 in the same way. The dominant feature of this motion is movement of the extracellular sides of H5, H7, and H8. These motions coincide with some of the transitions toward the IF conformation. The motions apparent in (D–F) PC2 and (G–I) PC3 of each conformation are visualized in the same way. For each PC, we identified a line of discrimination that separated regions of PC space occupied by WT and benign variants from regions dominated by pathogenic variants.