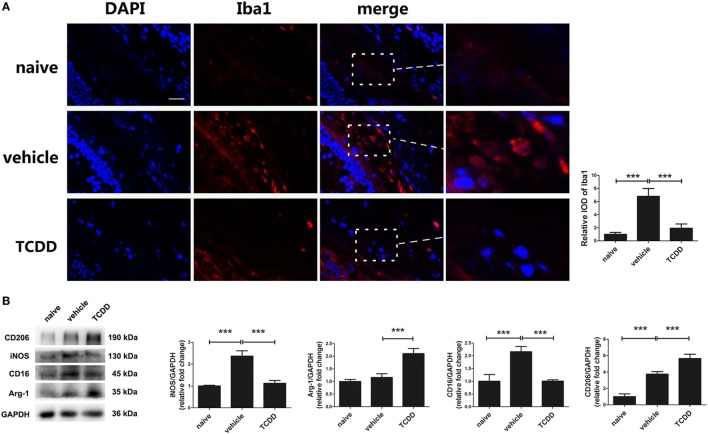
Figure 8.
TCDD treatment shifted the polarization of macrophages/microglia from M1 to M2 in experimental autoimmune uveitis mice. (A) Left, representative immunofluorescent images of ionized calcium-binding adaptor molecule 1 (Iba1) and DAPI in retinas of naive, vehicle, and TCDD-treated mice. Scale bar, 10 µm. Right, quantification of relative integrated optic density (IOD) of Iba1 (n = 4/group; mean ± SD;*** p < 0.001; one-way ANOVA). (B) Left, representative western blotting images of inducible nitric oxide synthase (iNOS), arginase-1 (Arg-1), CD16, and CD206 in retinas of naive, vehicle, and TCDD-treated mice. Right, quantifications of relative fold change of iNOS, Arg-1, CD16, and CD206 expressions (n = 4/group; mean ± SD;*** p < 0.001; one-way ANOVA).

