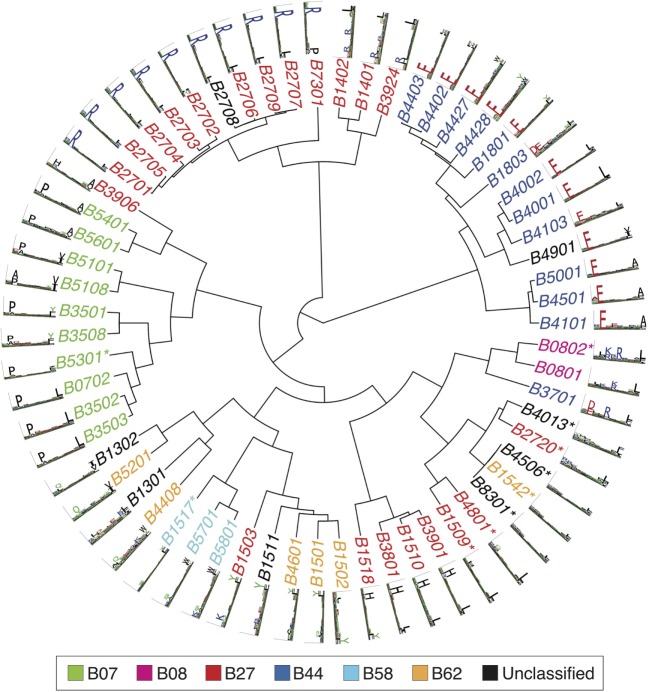
Figure 3.
Hierarchical clustering of HLA-B alleles based on their binding specificity. Stars indicate cases where only in vitro binding data were available to generate the motifs. In all other cases, only mass spectrometry data were used. Name colors and their description in the legend indicate supertypes as defined in Ref. (185).

