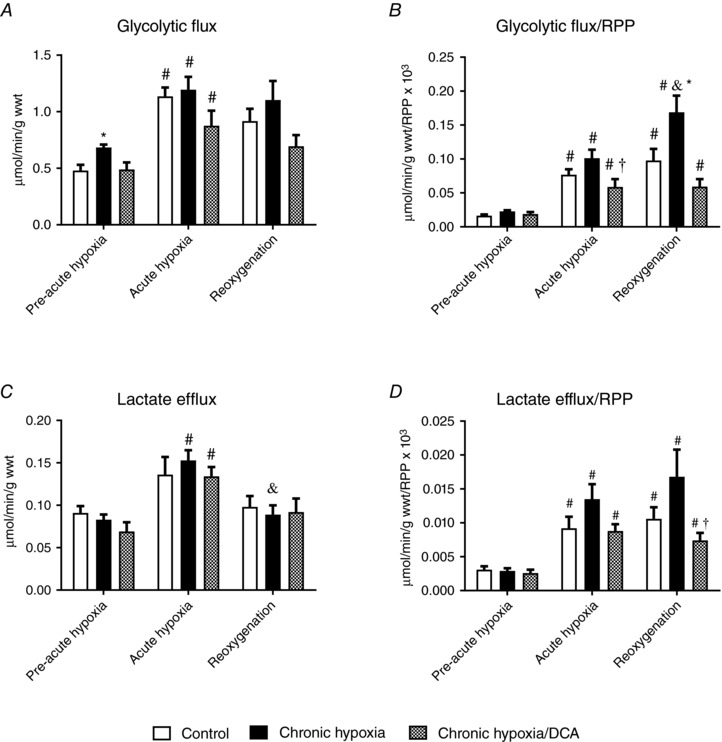
Figure 3. The effect of acute hypoxia and reoxygenation following chronic hypoxia ± DCA on cardiac glycolysis and lactate efflux (n = 8).

Glycolytic flux (A) and normalised to function (B). Lactate efflux (C) and normalised to function (D). * P < 0.05 vs. other experimental groups at a given time point; # P < 0.05 vs. pre‐acute hypoxia in the same experimental group; & P < 0.05 vs. acute hypoxia in the same experimental group; † P < 0.05 vs. chronic hypoxia at a given time point.
