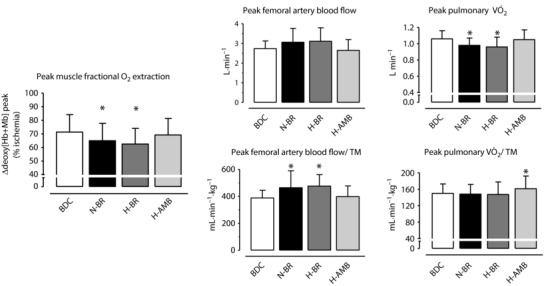
Figure 2. Peak values of the main variables related to O2 delivery and O2 utilization.

Mean ± SD peak values of NIRS‐obtained vastus lateralis muscle deoxygenation (∆[deoxy(Hb + Mb)]). Left: variable estimating fractional O2 extraction. Data are expressed as a percentage of values obtained during a transient limb ischaemia at the end of the test. Middle: mean ± SD values of peak arterial flow (expressed in L min−1 and in mL min−1 kg−1 of thigh muscle mass) are shown. Right: mean ± SD values of peak pulmonary (expressed in L min−1 and in mL min−1 kg−1 of thigh muscle mass) are shown. Data are presented for BDC, N‐BR, H‐BR and H‐AMB. For further details, see text. * P < 0.05 vs. BDC.
