
FIGURE 5.
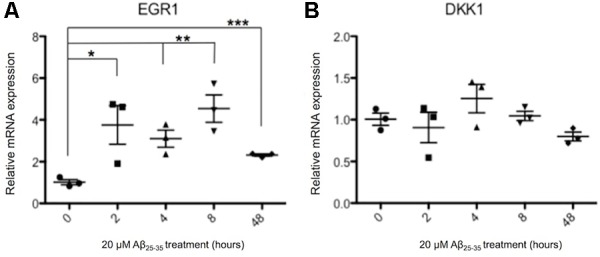
Changes in EGR1 (A) and DKK1 (B) gene expression in Aβ-treated neurons. Neurons from three independent differentiations were treated with 20 μM Aβ25-35 peptides for up to 48 h and expression of genes quantified by qPCR relative to housekeeper genes. The relative gene expression levels are normalized to the pre-exposure baseline ± SEM, and unpaired t-tests were performed for all four time points. (∗p < 0.05, ∗∗p < 0.005, ∗∗∗p < 0.001).