
FIGURE 8.
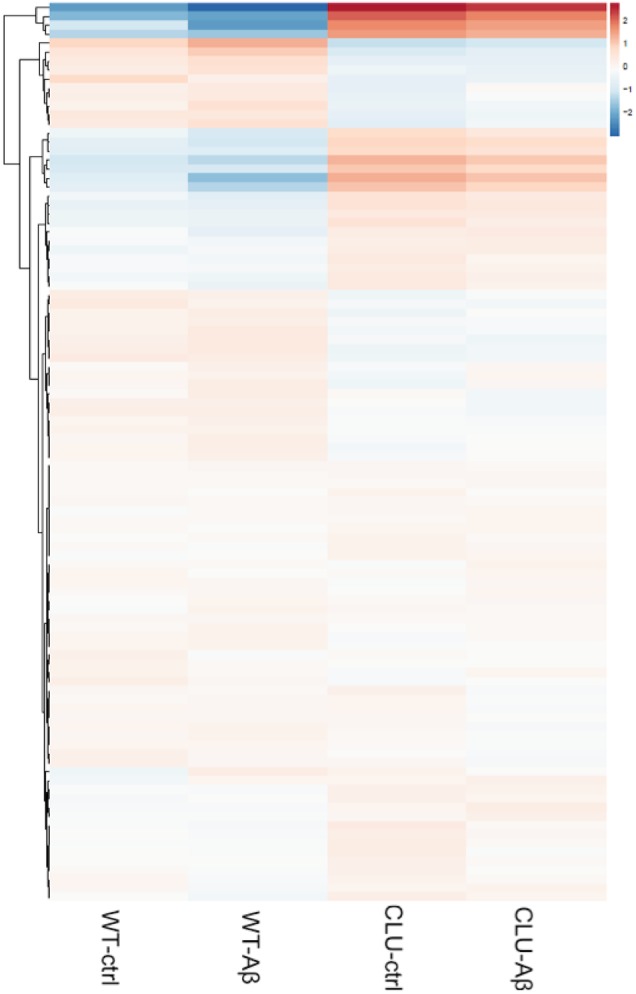
A heatmap of regularized log transformed counts of all genes in the four conditions. A plot of the regularized log transformed counts for all genes measured shows a greater difference in gene expression in CLU-/- compared to wild type neurons, than between treatment groups across the whole genome. Red indicates upregulation; blue indicates downregulation of gene set.