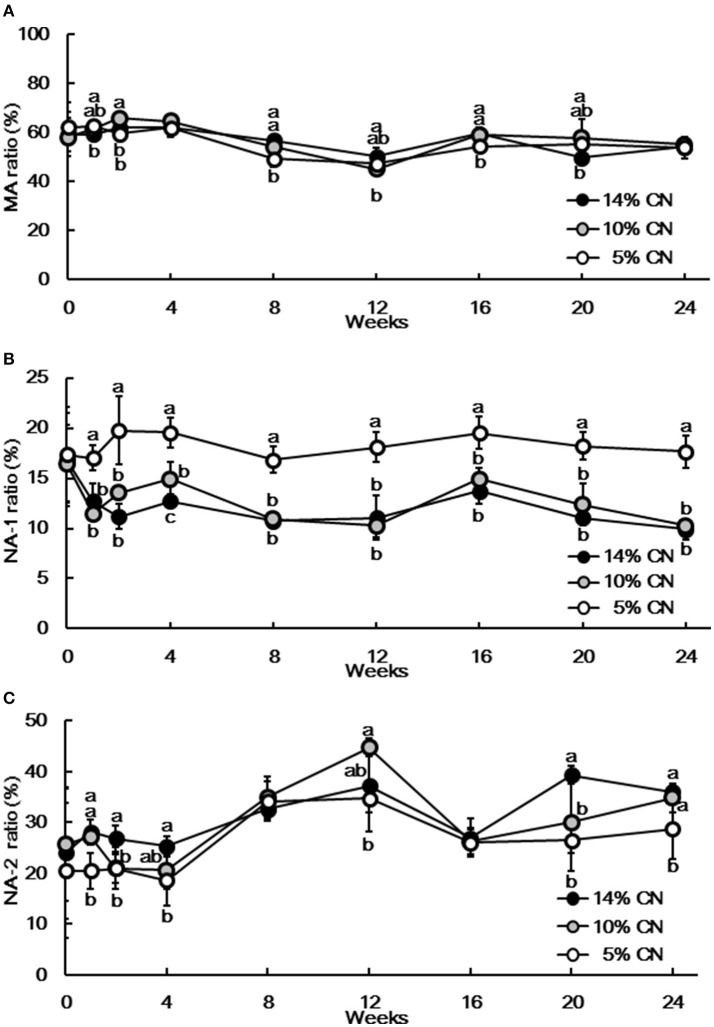
Figure 4.
Ratios of mercaptalbumin, non-mercaptalbumin-1, and non-mercaptalbumin-2 among total plasma albumin. Plasma samples, obtained at weeks 0, 1, 2, 4, 8, 12, 16, 20, and 24, were subjected to HPLC analysis to determine albumin redox state. Ratios of mercaptalbumin (A), non-mercaptalbumin-1 (B), and non-mercaptalbumin-2 (C) among total albumin are expressed as means ± SD (n = 6). CN, MA, and NA denote casein, mercaptalbumin, and non-mercaptalbumin, respectively.

