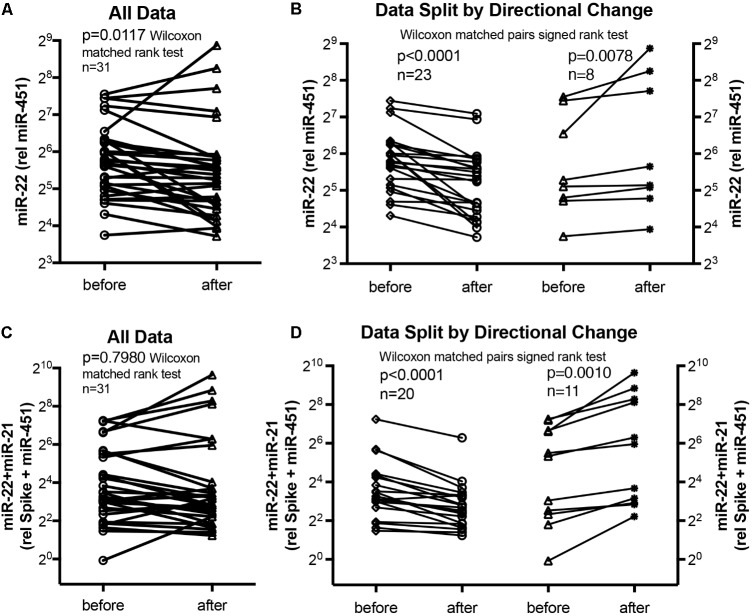
FIGURE 2.
Circulating serum miRNA values in the supervised exercise training intervention study. Symbols and lines graphs show miR-22-3p relative to miR-451a (10,000×) values (A,B), or miR-22-3p + miR-21-5p relative to spike-RNA + miR-451a (10,000×) values (C,D) in serum samples obtained from patients (Ehlken et al., 2016; Grunig et al., 2012a) before and after exercise training intervention. All of the data are plotted in (A,C); in (B,D) the data are separated by the directional change in the samples after exercise training intervention. Groups before and after intervention were compared with the Wilcoxon matched pairs signed rank test; p < 0.05 was considered significant.

