Fig. 3.

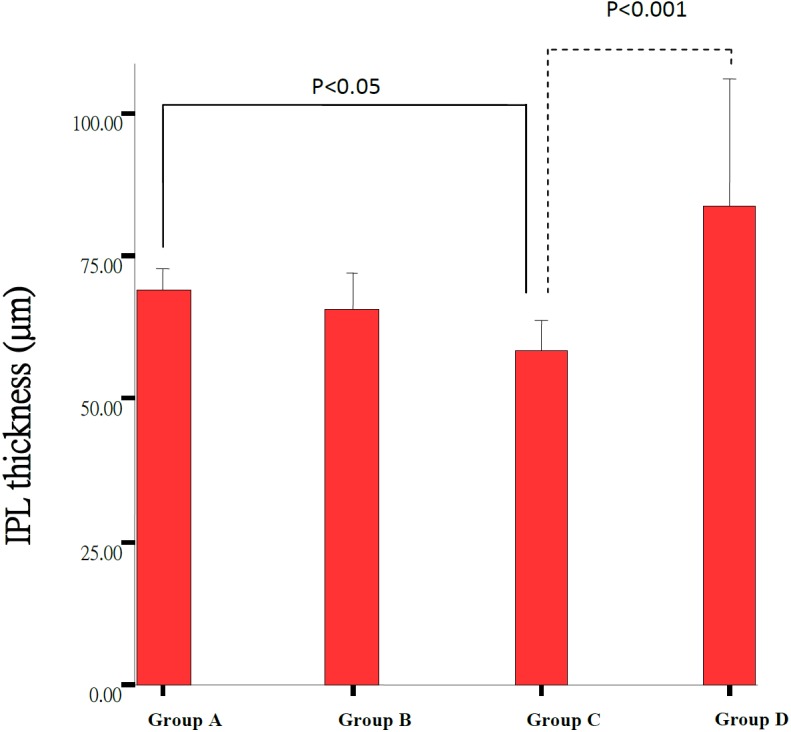
Comparison of the IPL thickness of the retinas between Group A (n=7), Group B (n=7), Group C (n=9) and control Group D (n=3). Each group result presents Mean ± SD. Significant difference (P<0.05) was noted between Group C and Group A.

Comparison of the IPL thickness of the retinas between Group A (n=7), Group B (n=7), Group C (n=9) and control Group D (n=3). Each group result presents Mean ± SD. Significant difference (P<0.05) was noted between Group C and Group A.