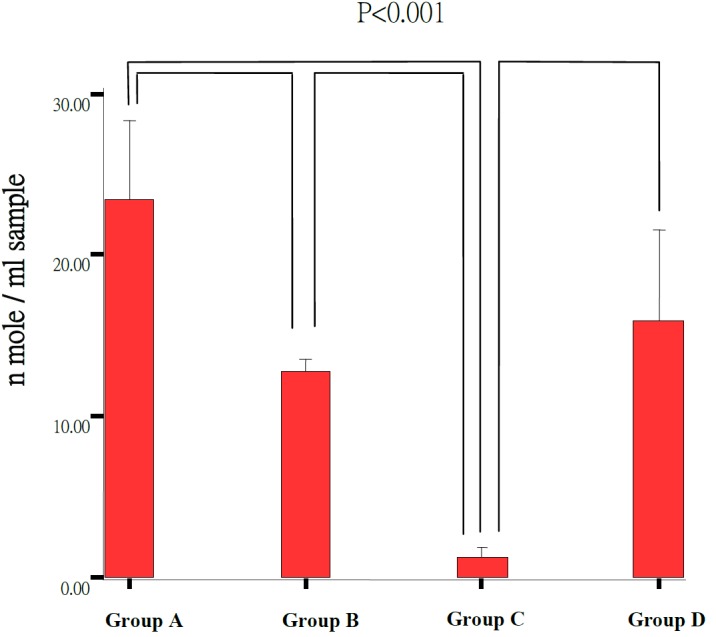
Fig. 7.

Retinal GSH and GSSG level in experimental groups. The Group C (n=3) showed significant lower concentration than the Group A (n=5), Group B (n=6) and Group D (n=3) (P<0.001). The Group A showed significant higher concentration of total glutathione than Group B (P<0.001).
