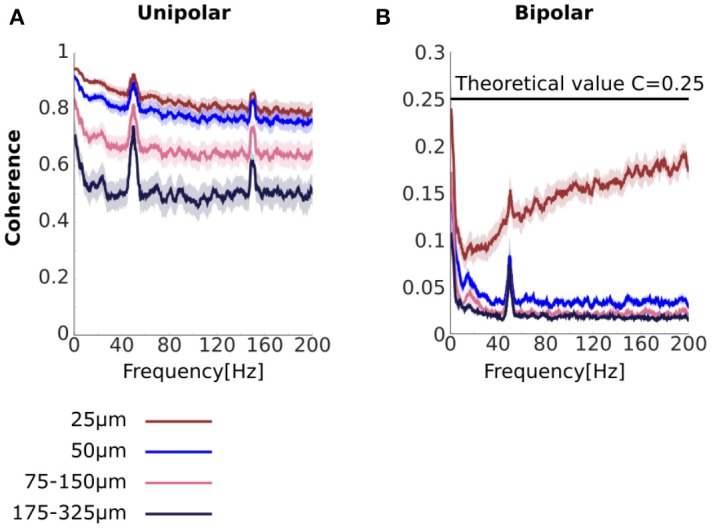
Figure 3.

Unipolar and bipolar coherence. (A,B) Unipolar (A) and bipolar (B) coherence averaged across signal pairs separated by 25 (brown), 50 (blue), 75–150 (pink), 175–325 μm (black) (see Methods for details). The very high unipolar coherences are consistent with the presence of strong common signals. Bipolar derivations that share a unipolar signals in their derivation are separated by 25 μm (see Figure 1). Horizontal line at C = 0.25 represents theoretical coherence value when the NCR = 1. Peaks at 50 and 150 Hz are due to line noise and its harmonic. Shaded area represents sem across flies (N = 13).
