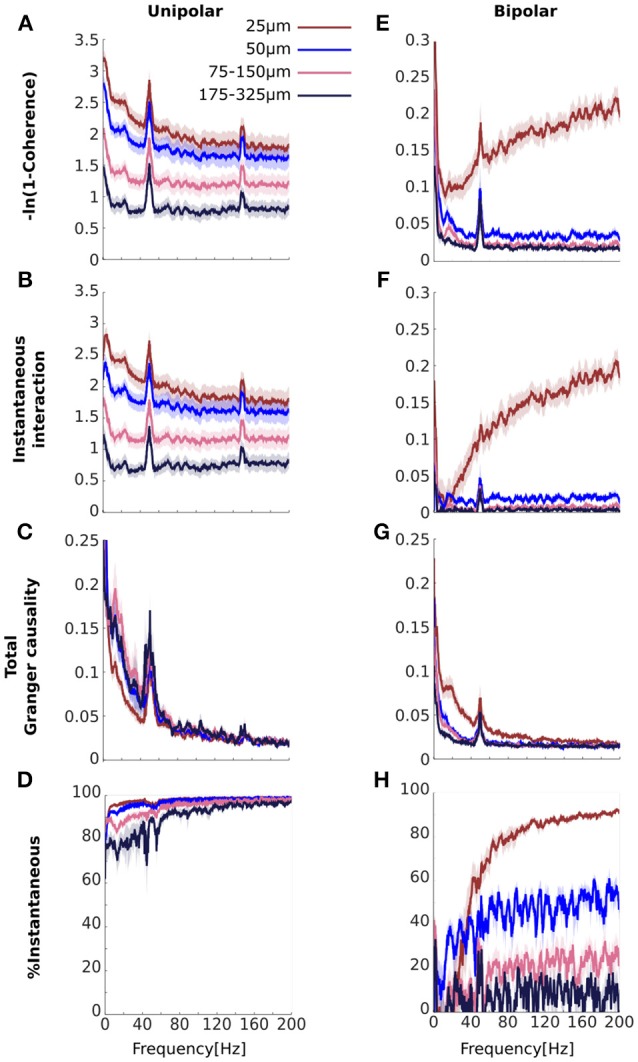
Figure 5.

Comparisons of the results for transformed coherence, instantaneous interaction and total Granger causality computed from the experimental data (A–D) for unipolar signals and (E–H) for bipolar derivations. (A, E) Transformed coherence (B,F), instantaneous interaction, (C,G), total Granger causality, and (D,H) the percentage of transformed coherence that is accounted for by instantaneous interaction. The color of each line represents the separation between signal pairs (brown for 25 μm, blue for 50 μm, pink for 75–150 μm and black for 175–325 μm, see Methods for details). Bipolar derivations separated by 25 μm share a unipolar signal in their derivation. Peaks at 50 Hz and 150 Hz are due to line noise. Shaded area represents sem across flies (N = 13).
