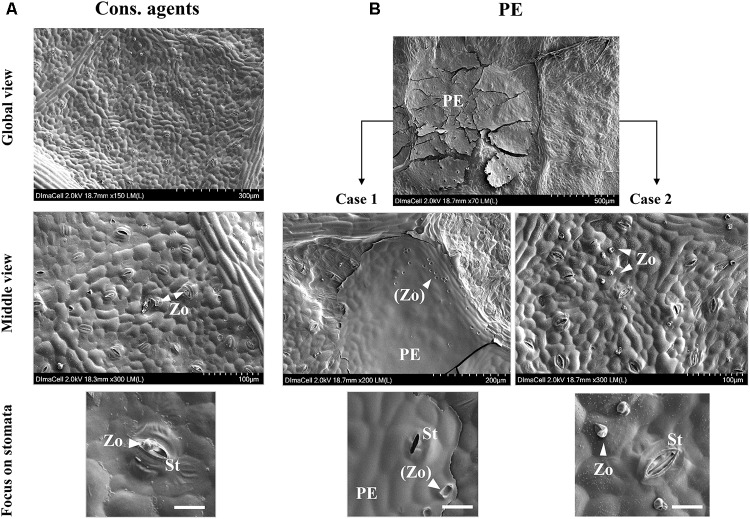
FIGURE 9.
SEM observation of leaf surfaces at 24 hpi after treatment by cons. agents (A) or PE (B) treatments, and P. viticola inoculation (105 sporangia mL−1). Top line of pictures show global overview of leaf surface to evidence deposits left on leaf surfaces or not; center line of pictures show middle view in order to point out zoospore presence around potential infection sites. For PE treatments, two cases were observed: (1) dried PE droplet forming a thin layer covering stomata access, or (2), outside of any dried droplet deposit, zoospores not encysted in stomata. Bottom line of pictures show focuses on stomata in each case. PE, PE droplet residue; St, stomata; Zo, zoospore; (Zo), zoospore ‘footprints.’ Embedded scale bars display the corresponding size on pictures: Global view = 300 or 500 μm; Middle view = 100 or 200 μm; Focus on stomata = 20 μm.

