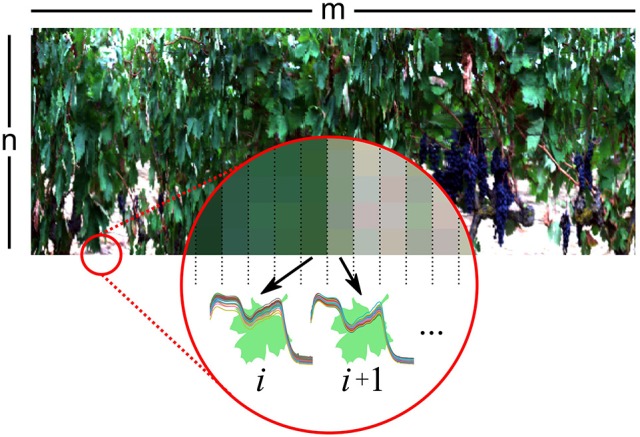
Figure 2.

Each m × n hyperspectral image was processed column by column. For each column i, each pixel (spectrum) was compared with a signature leaf spectrum. If a certain threshold of belonging was surpassed, the pixel was marked as leaf pixel. Afterwards, all leaf pixels from the column i were averaged.
