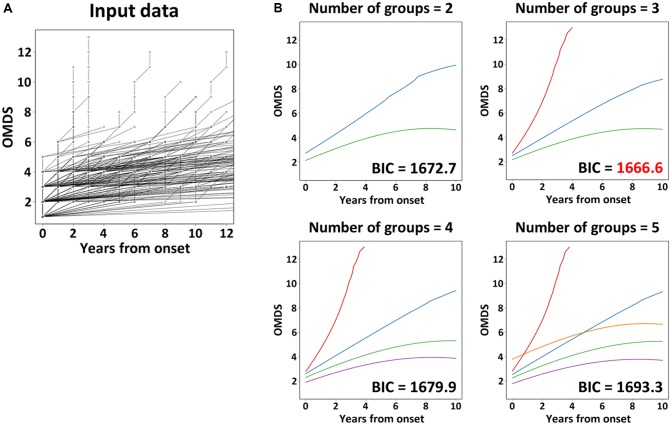
FIGURE 2.
Latent class mixed model analysis. The graph (A) shows the chronological change of Osame motor disability score (OMDS) from the onset to diagnosis in patients with HAM/TSP (n = 205), which was used as input data for latent class mixed model (LCMM) analysis. The graphs (B) show the representative progression pattern of OMDS when we set 2–5 latent classes. The horizontal axis represents the elapsed years from onset. The vertical axis represents OMDS. BIC, Bayesian Information Criterion.

