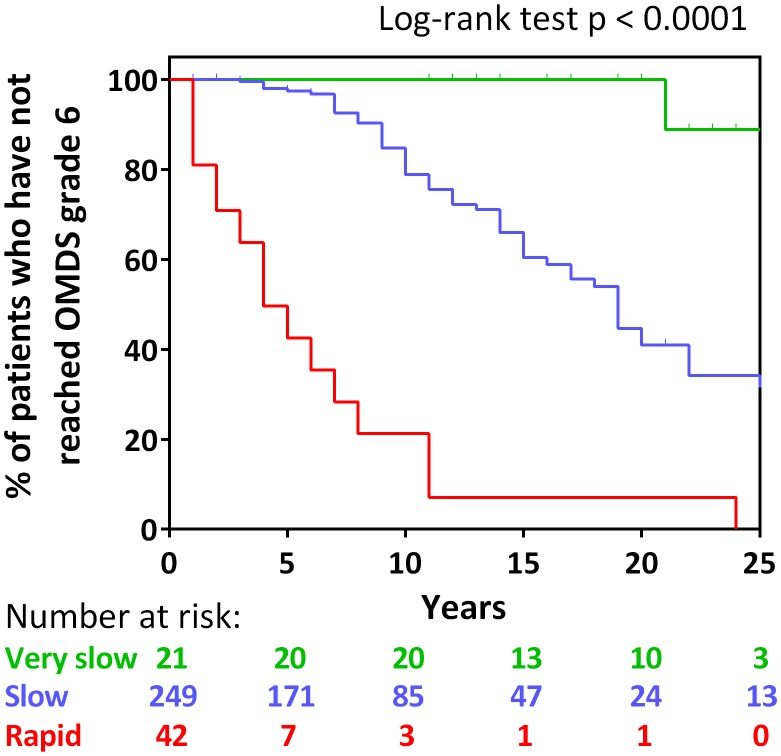
FIGURE 3.
Kaplan–Meier analysis. Kaplan–Meier analysis to evaluate time from Osame motor disability score (OMDS) grade 2 to deteriorating to OMDS grade 6 for the following patient group defined by the difference of the clinical course from onset: rapid progressors (red line), slow progressors (blue line), and very slow progressors (green line). The horizontal axis represents the elapsed years from OMDS grade 2. The vertical axis represents percentage of patients who have not reached OMDS grade 6. Numbers shown below the graph indicate number at risk. Differences in the degree of progress among the three groups were tested by log-rank test. Significance was defined as p < 0.05.

