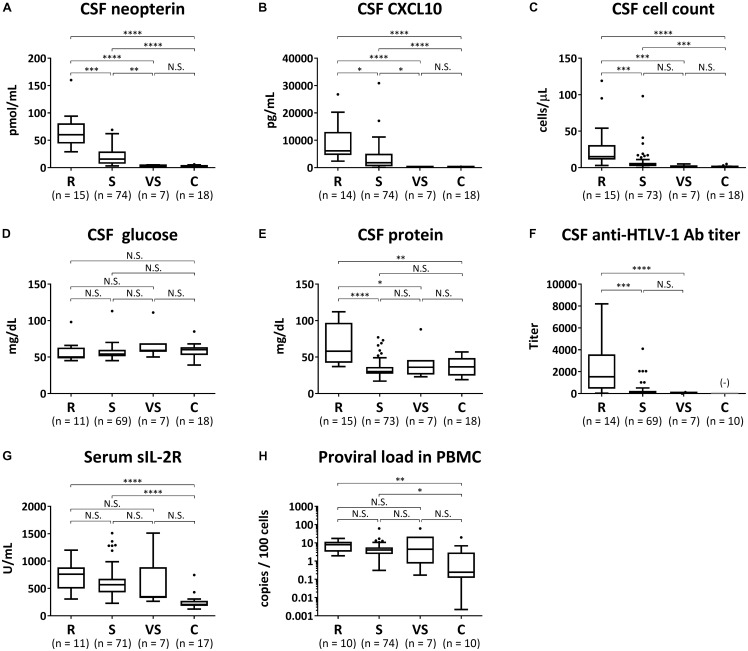
FIGURE 4.
Biomarker analyses. The following eight candidate biomarkers were compared among rapid progressors (R), slow progressors (S), very slow progressors (VS), and controls (C): (A) cerebrospinal fluid (CSF) levels of neopterin, (B) C-X-C motif chemokine 10 (CXCL10), (C) cell count, (D) glucose, (E) total protein, and (F) anti-HTLV-1 antibody titer; (G) serum level of soluble IL-2 receptor (sIL-2R); (H) proviral loads in peripheral blood mononuclear cells (PBMC). Data are shown as a Tukey box plots: data are presented as median (interquartile range; IQR) and whiskers represent 1.5 IQR and black dots represent outliers. Statistical analysis was performed using the Kruskal–Wallis test followed by Dunn’s post hoc test: ∗∗∗∗p < 0.0001, ∗∗∗p < 0.001, ∗∗p < 0.01, ∗p < 0.05; N.S., not significant; Ab, antibody. (−) indicates that the CSF anti-HTLV-1-antibody test in normal control group was all negative.

