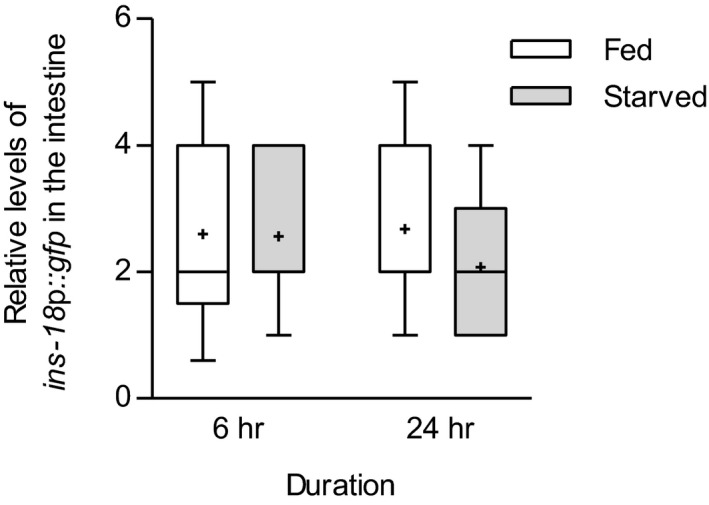
Figure EV5. Expression of ins‐18 promoter upon starvation.

Relative fluorescence intensity of expressing ins‐18p::gfp in the intestine in 6‐h and 24‐h fed and starved conditions. n = 25–40. Tops and bottoms of boxes indicate the 25th and 75th percentiles, respectively; whiskers represent 10th–90th percentile. Median is indicated by a horizontal line, and the average is marked by “+” in the box.
