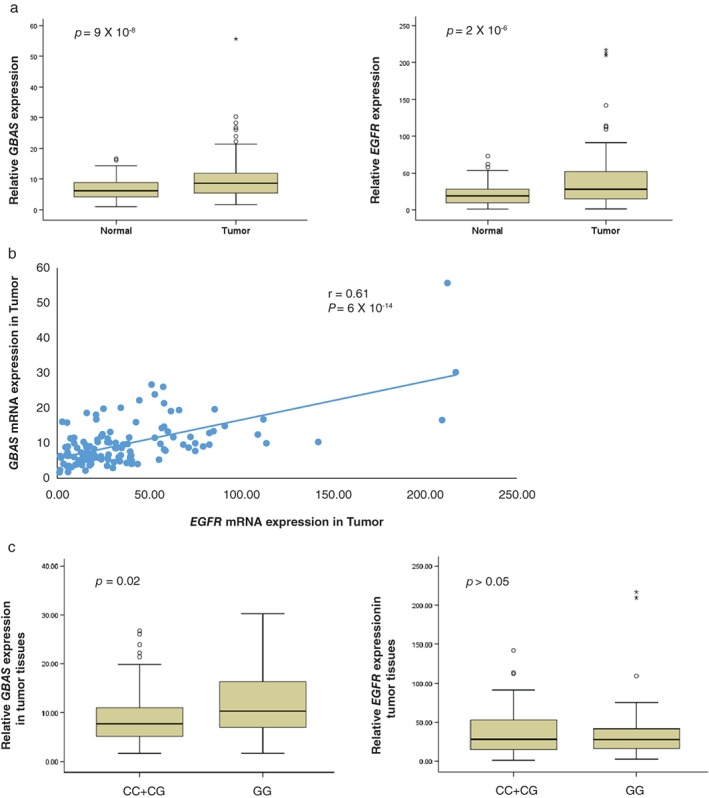
Figure 2.

(a) GBAS and EGFR messenger RNA (mRNA) expression levels in tumor and non‐malignant lung tissues. *P < 0.001 by paired t‐test. (b) Relationship between GBAS and EGFR mRNA levels in lung tumor tissue (correlation coefficient = 0.61, P < 0.001 by Pearson's method). (c) GBAS and EGFR mRNA expression levels according to rs9642391C>G genotype in lung tumor tissues.
